Interpret Redis LATENCY DOCTOR with operating-system evidence
For Redis latency doctor, begin by proving which system and state you are about to affect. The latency monitor samples configured event classes inside Redis, while LATENCY DOCTOR summarizes detected spikes and suggested causes. The safest useful answer is therefore an evidence sequence: identify the target, capture its effective state, make one bounded change, and verify through a path independent of the command that accepted the change.
TL;DR: Event history aligns with client latency and host CPU, memory, fork, disk, or scheduler evidence. Start with redis-cli INFO server, stop if the evidence instead shows that the threshold was disabled, the spike is below sampling resolution, or network delay occurs outside Redis, and keep this recovery action ready: restore the prior threshold and compare the same window with host and client telemetry before changing Redis configuration.
Assumed audience: Redis operators who can distinguish a cache from a system of record and run bounded diagnostics against the correct instance. This field guide assumes a controlled maintenance window and working recovery access.
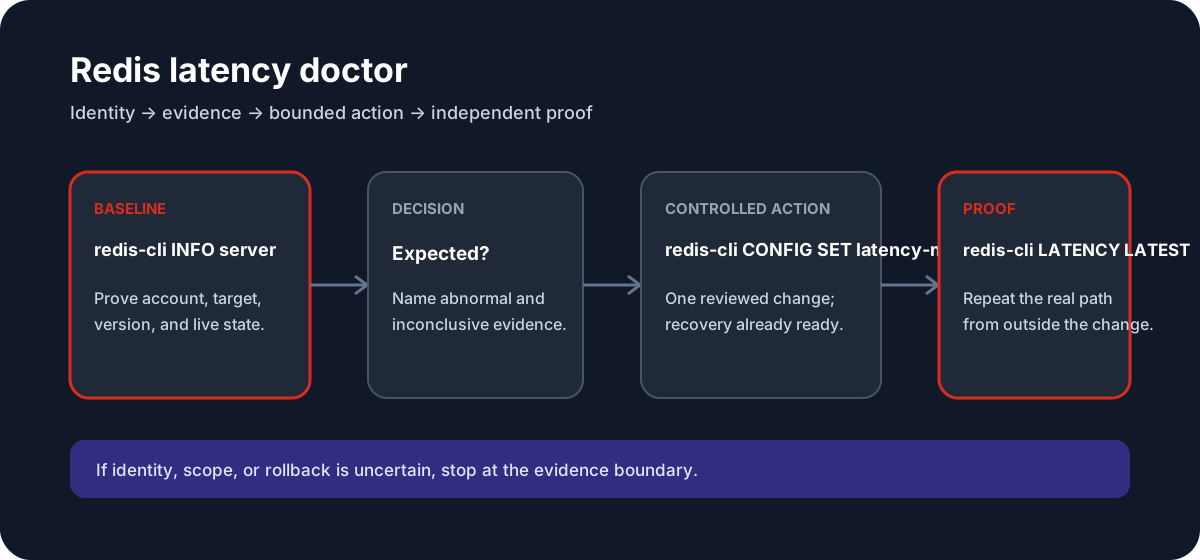
Direct answer and success condition
The success condition for Redis latency doctor is not a zero exit code. It is that event history aligns with client latency and host CPU, memory, fork, disk, or scheduler evidence. A command may return successfully while a controller is still converging, a client is using cached state, a remote dependency is unavailable, or the wrong account, namespace, region, host, database, repository, or process accepted the request.
Use the task boundary—client connection, command execution, in-memory data structures, eviction, persistence, replication, and network exposure—to decide what the result proves. The candidate action belongs only at the first layer whose observed state contradicts the desired outcome. If the baseline cannot locate that contradiction, do not make the action broader.
Working model
For Redis operations, use this operational model: Redis processes commands through an event-driven server, mutates in-memory data, optionally persists changes, and propagates an asynchronous command stream to replicas. This model matters for Redis latency doctor because the latency monitor samples configured event classes inside Redis, while LATENCY DOCTOR summarizes detected spikes and suggested causes. It also separates four forms of evidence that are often collapsed:
- Declared state: files, manifests, playbooks, policies, arguments, or API requests say what should happen.
- Effective state: the running tool or service reports what it actually loaded and selected.
- Resource state: processes, objects, data, network paths, and queues reflect the change.
- Outcome state: the original user, automation, or recovery workflow succeeds from the relevant vantage point.
Declared state without effective state is only intent. Effective state without outcome state is only partial convergence. Keep these labels in the change record so another operator can tell what was measured.
Preflight: identity, scope, and recovery
Confirm the role, persistence mode, dataset criticality, and available memory before running a command that scans keys, changes configuration, or affects replication.
Record the current UTC time, operator identity, tool version, exact target identifiers, last successful execution, recent related changes, and the owner of the workload. Save the effective configuration or object state using its supported read-only interface. Do not store credentials, complete environment dumps, private customer data, or unrestricted topology in the ticket.
The recovery path for this guide is explicit: restore the prior threshold and compare the same window with host and client telemetry before changing Redis configuration. Rehearse the targeting syntax and confirm that recovery does not depend on the same account, network path, key, state file, database, repository, or process being changed.
Stop before changing state when any of these statements is true:
- The target can be selected by a default or ambiguous alias.
- The current configuration or binding cannot be reconstructed.
- The only privileged or remote session would be put at risk.
- The command affects an unbounded host, key, object, snapshot, branch, or resource set.
- The expected output cannot be distinguished from stale, cached, or partial state.
Capture the baseline
Run the following commands individually after replacing example identifiers deliberately:
redis-cli INFO server
redis-cli CONFIG GET latency-monitor-threshold
redis-cli LATENCY LATEST
redis-cli LATENCY DOCTOR
For Redis latency doctor, classify the output before proposing a fix:
- Expected evidence: event history aligns with client latency and host CPU, memory, fork, disk, or scheduler evidence.
- Abnormal evidence: the threshold was disabled, the spike is below sampling resolution, or network delay occurs outside Redis.
- Inconclusive evidence: no output, permission errors, incomplete history, disabled instrumentation, a different version, or a different control plane can all hide the relevant state. Confirm those assumptions rather than translating absence into health.
Preserve timestamps and exit statuses for decisive observations. Prefer machine-readable output when it can be filtered without collecting secrets. Compare a healthy peer only by equivalent effective fields; copying its entire configuration can introduce a second problem.
Controlled action
This is state-changing example syntax. It is intentionally presented after the baseline and must not be pasted with example targets:
redis-cli CONFIG SET latency-monitor-threshold 100The action is justified only if the baseline predicts its effect at the named boundary. For Redis latency doctor, the principal risk is that enabling aggressive monitoring during an incident adds observation overhead and may still miss tail latency. Review the exact expansion of variables, globs, resource addresses, inventory patterns, database identities, repository locations, and cloud regions before approval.
Prefer a canary, dry run, saved plan, isolated restore, configuration validator, transaction, immutable artifact, or runtime drain when the platform supplies one. Record the command, approver, UTC time, and expected convergence interval. Do not stack unrelated cleanup, restart, permission, and configuration actions into the same observation window.
Independent verification
Repeat the state inspection and then exercise the original path:
redis-cli LATENCY LATEST
redis-cli LATENCY HISTORY command
redis-cli --latency-history -i 1
Verification for Redis latency doctor must answer five questions:
- Did the intended identity accept the operation?
- Did effective state converge to the reviewed value?
- Did the underlying resource or data path change as predicted?
- Did the real consumer succeed from an independent vantage point?
- Did adjacent safety signals—capacity, latency, errors, replication, audit, or persistence—remain healthy?
If redis-cli LATENCY LATEST passes but the consumer still fails, the local boundary may be repaired while another layer remains broken. Keep the new evidence, stop making the change broader, and move to the next falsifiable boundary.
Decision branches
The baseline contradicts the guide
If the threshold was disabled, the spike is below sampling resolution, or network delay occurs outside Redis, the candidate action no longer follows from the evidence. Re-establish identity and scope, shorten the observation window, and formulate a mechanism that the next read-only command can disprove.
The command succeeds but nothing converges
A successful redis-cli CONFIG SET latency-monitor-threshold 100 proves only that one interface accepted the request. It may not prove persistence, controller completion, process reload, data compatibility, replication, traffic admission, or client refresh. Inspect those transitions in order.
The change makes the outcome worse
Execute the prepared recovery: restore the prior threshold and compare the same window with host and client telemetry before changing Redis configuration. Preserve the failed candidate, event times, and relevant logs. Avoid repeated restarts, broad resets, garbage collection, pruning, history rewriting, or cleanup that can erase the evidence needed to explain the failure.
The result is mixed
Mixed results normally mean scope differs across hosts, workers, replicas, zones, clients, branches, or repositories. Partition the evidence by identity instead of averaging it. Hold further rollout until each partition has an explicit disposition.
Review checklist
- Confirm the operator, account, region, namespace, host, resource, repository, database, or branch.
- Print the installed tool version and resolve the effective configuration.
- Capture the baseline and name one observation that would disprove the proposed mechanism.
- Mark
redis-cli CONFIG SET latency-monitor-threshold 100as state-changing in review. - Keep recovery access independent and test the exact rollback target.
- Change one layer and wait for its documented convergence boundary.
- Repeat the original user or automation path, not only the control-plane query.
- Watch error rate, latency, capacity, data durability, audit, and persistence after the change.
- Remove temporary credentials, traces, restored data, debug settings, and candidate resources under policy.
- Update this field guide when observed behavior differs from the source-reviewed model.
Investigate it in Tryssh
$ redis-cli LATENCY LATEST
Expected: event history aligns with client latency and host CPU, memory, fork, disk, or scheduler evidence.
Tryssh can help preserve this evidence trail and place a state-changing command behind human approval. It cannot decide the correct production target, authorize a cloud or database change, guarantee backup completeness, or replace independent recovery access.
Evidence and review status
This Redis latency doctor field guide was source-reviewed on 2026-07-29 against current upstream or first-party documentation. Commands use example identifiers and were not executed against every distribution, service version, provider, database topology, repository backend, network, or workload. Provider-managed services may expose a different control plane or restrict local commands.
The article makes no ranking guarantee and does not treat documentation review as reproduction. Validate installed versions, permissions, feature support, recovery behavior, and billing or data-retention consequences in your environment.
Limitations and trade-offs
Enabling aggressive monitoring during an incident adds observation overhead and may still miss tail latency. A narrow safe action may take longer than a broad reset, and a strong verification plan may require temporary capacity or an isolated restore target. Those costs are part of reliable operations, not optional ceremony.
Do not use a search result as authority to change production. The live system, reviewed policy, upstream versioned documentation, and accountable operator remain the sources of truth.
Continue the cluster
Next, read Redis MEMORY USAGE or Redis SLOWLOG. For broader context, use the Redis operations foundation guide and the SSH hardening checklist.