Choose a Prometheus alert for duration from failure tolerance
For Prometheus alert for duration, the safest approach is a bounded operational change, not a command pasted without context. This runbook starts with effective state, shows the smallest candidate action, and finishes by repeating the real user or system path.
TL;DR: The for clause keeps a continuously true alert pending before firing; keep_firing_for can retain firing state briefly after the expression clears. Capture a baseline withpromtool check rules /etc/prometheus/rules/*.yml, make the reviewed change only when the evidence matches, then verify withpromtool query instant http://127.0.0.1:9090 'ALERTS{alertname=\"ServiceErrorRateHigh\"}'and keep the rollback ready.
Audience: operators who can inspect Prometheus targets, labels, rules, and query results without treating a dashboard as ground truth. This guide assumes familiarity with Prometheus operations and a change window appropriate to the system.
The direct answer
The pending delay filters tolerable blips but fires before the user-impact budget is exhausted. That is the success condition for Prometheus alert for duration; command completion by itself is not enough.
The important boundary is instrumentation, scrape discovery, relabeling, sample ingestion, query evaluation, rule state, and notification delivery. The for clause keeps a continuously true alert pending before firing; keep_firing_for can retain firing state briefly after the expression clears. If an observation does not identify which side of that boundary failed, collect a narrower observation before changing state.
How the mechanism works
For Prometheus alert for duration, use this mental model: Prometheus discovers targets, transforms labels, scrapes timestamped samples, evaluates PromQL over those series, and turns rule results into recorded series or alert states. The model prevents a common mistake—treating configuration text, control-plane acceptance, process state, and end-user behavior as the same proof.
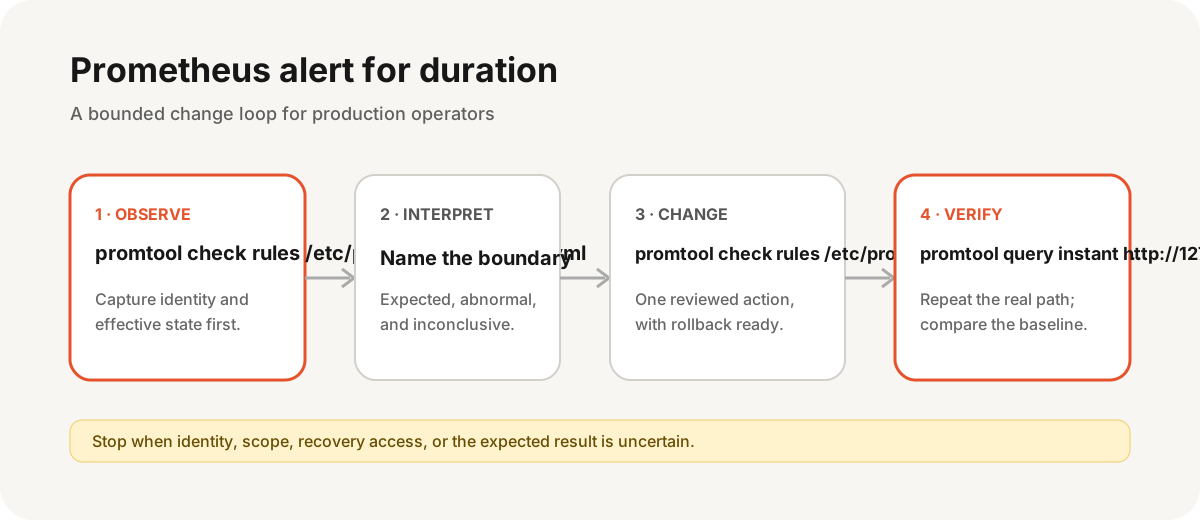
Follow four stages:
- Observe: identify the exact host, object, version, owner, and active configuration.
- Interpret: write the expected result, the abnormal result, and what would remain inconclusive.
- Change: apply one reviewed action at the narrowest layer that contradicts the baseline.
- Verify: repeat the original path and compare the same evidence, including adjacent safety controls.
Preflight and safety boundary
Run new queries over bounded ranges, estimate series growth, test rule files, and keep existing alerts until replacement coverage is proven.
Before Prometheus alert for duration, record UTC time, the current version or digest, the exact target, recent changes, and who owns the workload. The rollback for this runbook is: restore the previous rule file, reload after validation, and replay recorded data against candidate timing before another rollout.
Do not continue if the target identity is ambiguous, the current state cannot be saved, the only recovery session would be at risk, or the proposed command affects more objects than the brief names.
Capture the read-only baseline
Run these commands one at a time. Replace example names and addresses deliberately; do not paste production secrets into a transcript.
promtool check rules /etc/prometheus/rules/*.yml
promtool query instant http://127.0.0.1:9090 'ALERTS'
promtool query instant http://127.0.0.1:9090 'prometheus_rule_evaluation_failures_total'
Interpret the baseline before moving on:
- Expected: the pending delay filters tolerable blips but fires before the user-impact budget is exhausted.
- Abnormal: missing samples reset state, a long for hides fast exhaustion, or keep_firing_for obscures recovery.
- Inconclusive: missing output can also mean the wrong context, permissions, namespace, log window, binary, or target. Prove those assumptions before treating absence as health.
Save the decisive output, exit status, and timestamp. Redact credentials, customer data, private topology, tokens, and complete environment dumps.
Apply the smallest candidate change
The following is state-changing example syntax, not an instruction to run it unchanged:
sudo promtool check rules /etc/prometheus/rules/service.rules.yml
sudo kill -HUP \"$(pidof prometheus)\"
For Prometheus alert for duration, the proposed change is acceptable only when the read-only baseline predicts its effect and the rollback is available. The key risk is: choosing a duration by habit can either page on noise or wait through most of an outage.
Prefer an immutable artifact, validated configuration, dry-run, transaction, candidate object, or staged target when the tool supports one. Record the exact command and UTC time so later telemetry can be correlated to the change.
Verify the result from the outside in
promtool query instant http://127.0.0.1:9090 'ALERTS{alertname=\"ServiceErrorRateHigh\"}'
promtool query instant http://127.0.0.1:9090 'up{job=\"example\"}'
promtool check rules /etc/prometheus/rules/service.rules.yml
Verification for Prometheus alert for duration has three layers:
- The control plane or command reports the intended effective state.
- The process, resource, or data path reflects that state without a new pressure signal.
- The original user-visible or dependent-system path succeeds from an independent vantage point.
If promtool query instant http://127.0.0.1:9090 'ALERTS{alertname=\"ServiceErrorRateHigh\"}' succeeds but the original path still fails, stop. The change may have repaired a local symptom while DNS, policy, routing, caching, dependency, or client state remains broken.
Failure branches
The baseline does not match this runbook
When missing samples reset state, a long for hides fast exhaustion, or keep_firing_for obscures recovery, do not force the candidate command. Return to identity and scope, compare a healthy peer only through effective settings, and name a new falsifiable mechanism.
The change succeeds but behavior does not
A successful sudo promtool check rules /etc/prometheus/rules/service.rules.yml proves that one interface accepted a request. It does not prove convergence, readiness, data compatibility, external routing, or client recovery. Re-run the same evidence at each downstream boundary.
The change makes the system worse
Execute the written rollback: restore the previous rule file, reload after validation, and replay recorded data against candidate timing before another rollout. Preserve the failed candidate and relevant logs long enough to explain the outcome; do not destroy the evidence with broad cleanup or repeated restarts.
Operator checklist
- Confirm the exact target, context, identity, version, and active owner.
- Capture the read-only baseline and one disconfirming observation.
- Label
sudo promtool check rules /etc/prometheus/rules/service.rules.ymlas state-changing during review. - Keep recovery access and rollback independent of the path being edited.
- Change one layer, record UTC time, and wait for its real convergence boundary.
- Verify the original path, adjacent controls, resource pressure, and persistence.
- Update the runbook when observed behavior differs from the source-reviewed model.
Investigate it in Tryssh
$ promtool query instant http://127.0.0.1:9090 'ALERTS{alertname=\"ServiceErrorRateHigh\"}'
Expected: the pending delay filters tolerable blips but fires before the user-impact budget is exhausted.
Tryssh can preserve this evidence loop and show a state-changing command for human approval. It does not make the operator's identity, recovery access, rollback, or platform authority decisions.
Evidence and review status
This Prometheus alert for duration runbook was source-reviewed on 2026-07-29 against current first-party documentation. The commands are illustrative and use example targets. The page does not claim that the change was reproduced across every distribution, managed service, version, network, or workload.
Limitations and trade-offs
Choosing a duration by habit can either page on noise or wait through most of an outage. Managed platforms may generate configuration, restrict privileges, replace local state, or expose a different control plane than the upstream project. Confirm the installed version and provider contract before applying a repair.
Search visibility is not proof of operational correctness. Treat this page as a decision aid, preserve independent recovery, and stop when the evidence contradicts its assumptions.
Related operator runbooks
Continue with Prometheus blackbox exporter, Prometheus recording rules, the Prometheus operations foundation guide, and the SSH hardening checklist.